Example report

See an example MeterProof report

This sample PDF shows the full 8-page report output: compliance verdict with flow-weighted uncertainty, expanded uncertainty budget, flow bias analysis, step-by-step calculation workings, complete input record, instrument register, and annual flow profile back-test.

Design-point U
±0.68%
Flow-weighted U
±2.35%
Framework
EU ETS Tier 4
Report pages
8 pages
Flow-weighted verdict Type A + B budget Lab density bias Calculation workings Instrument register Flow profile back-test
Example MeterProof report first page showing flow-weighted compliance verdict

What the report includes

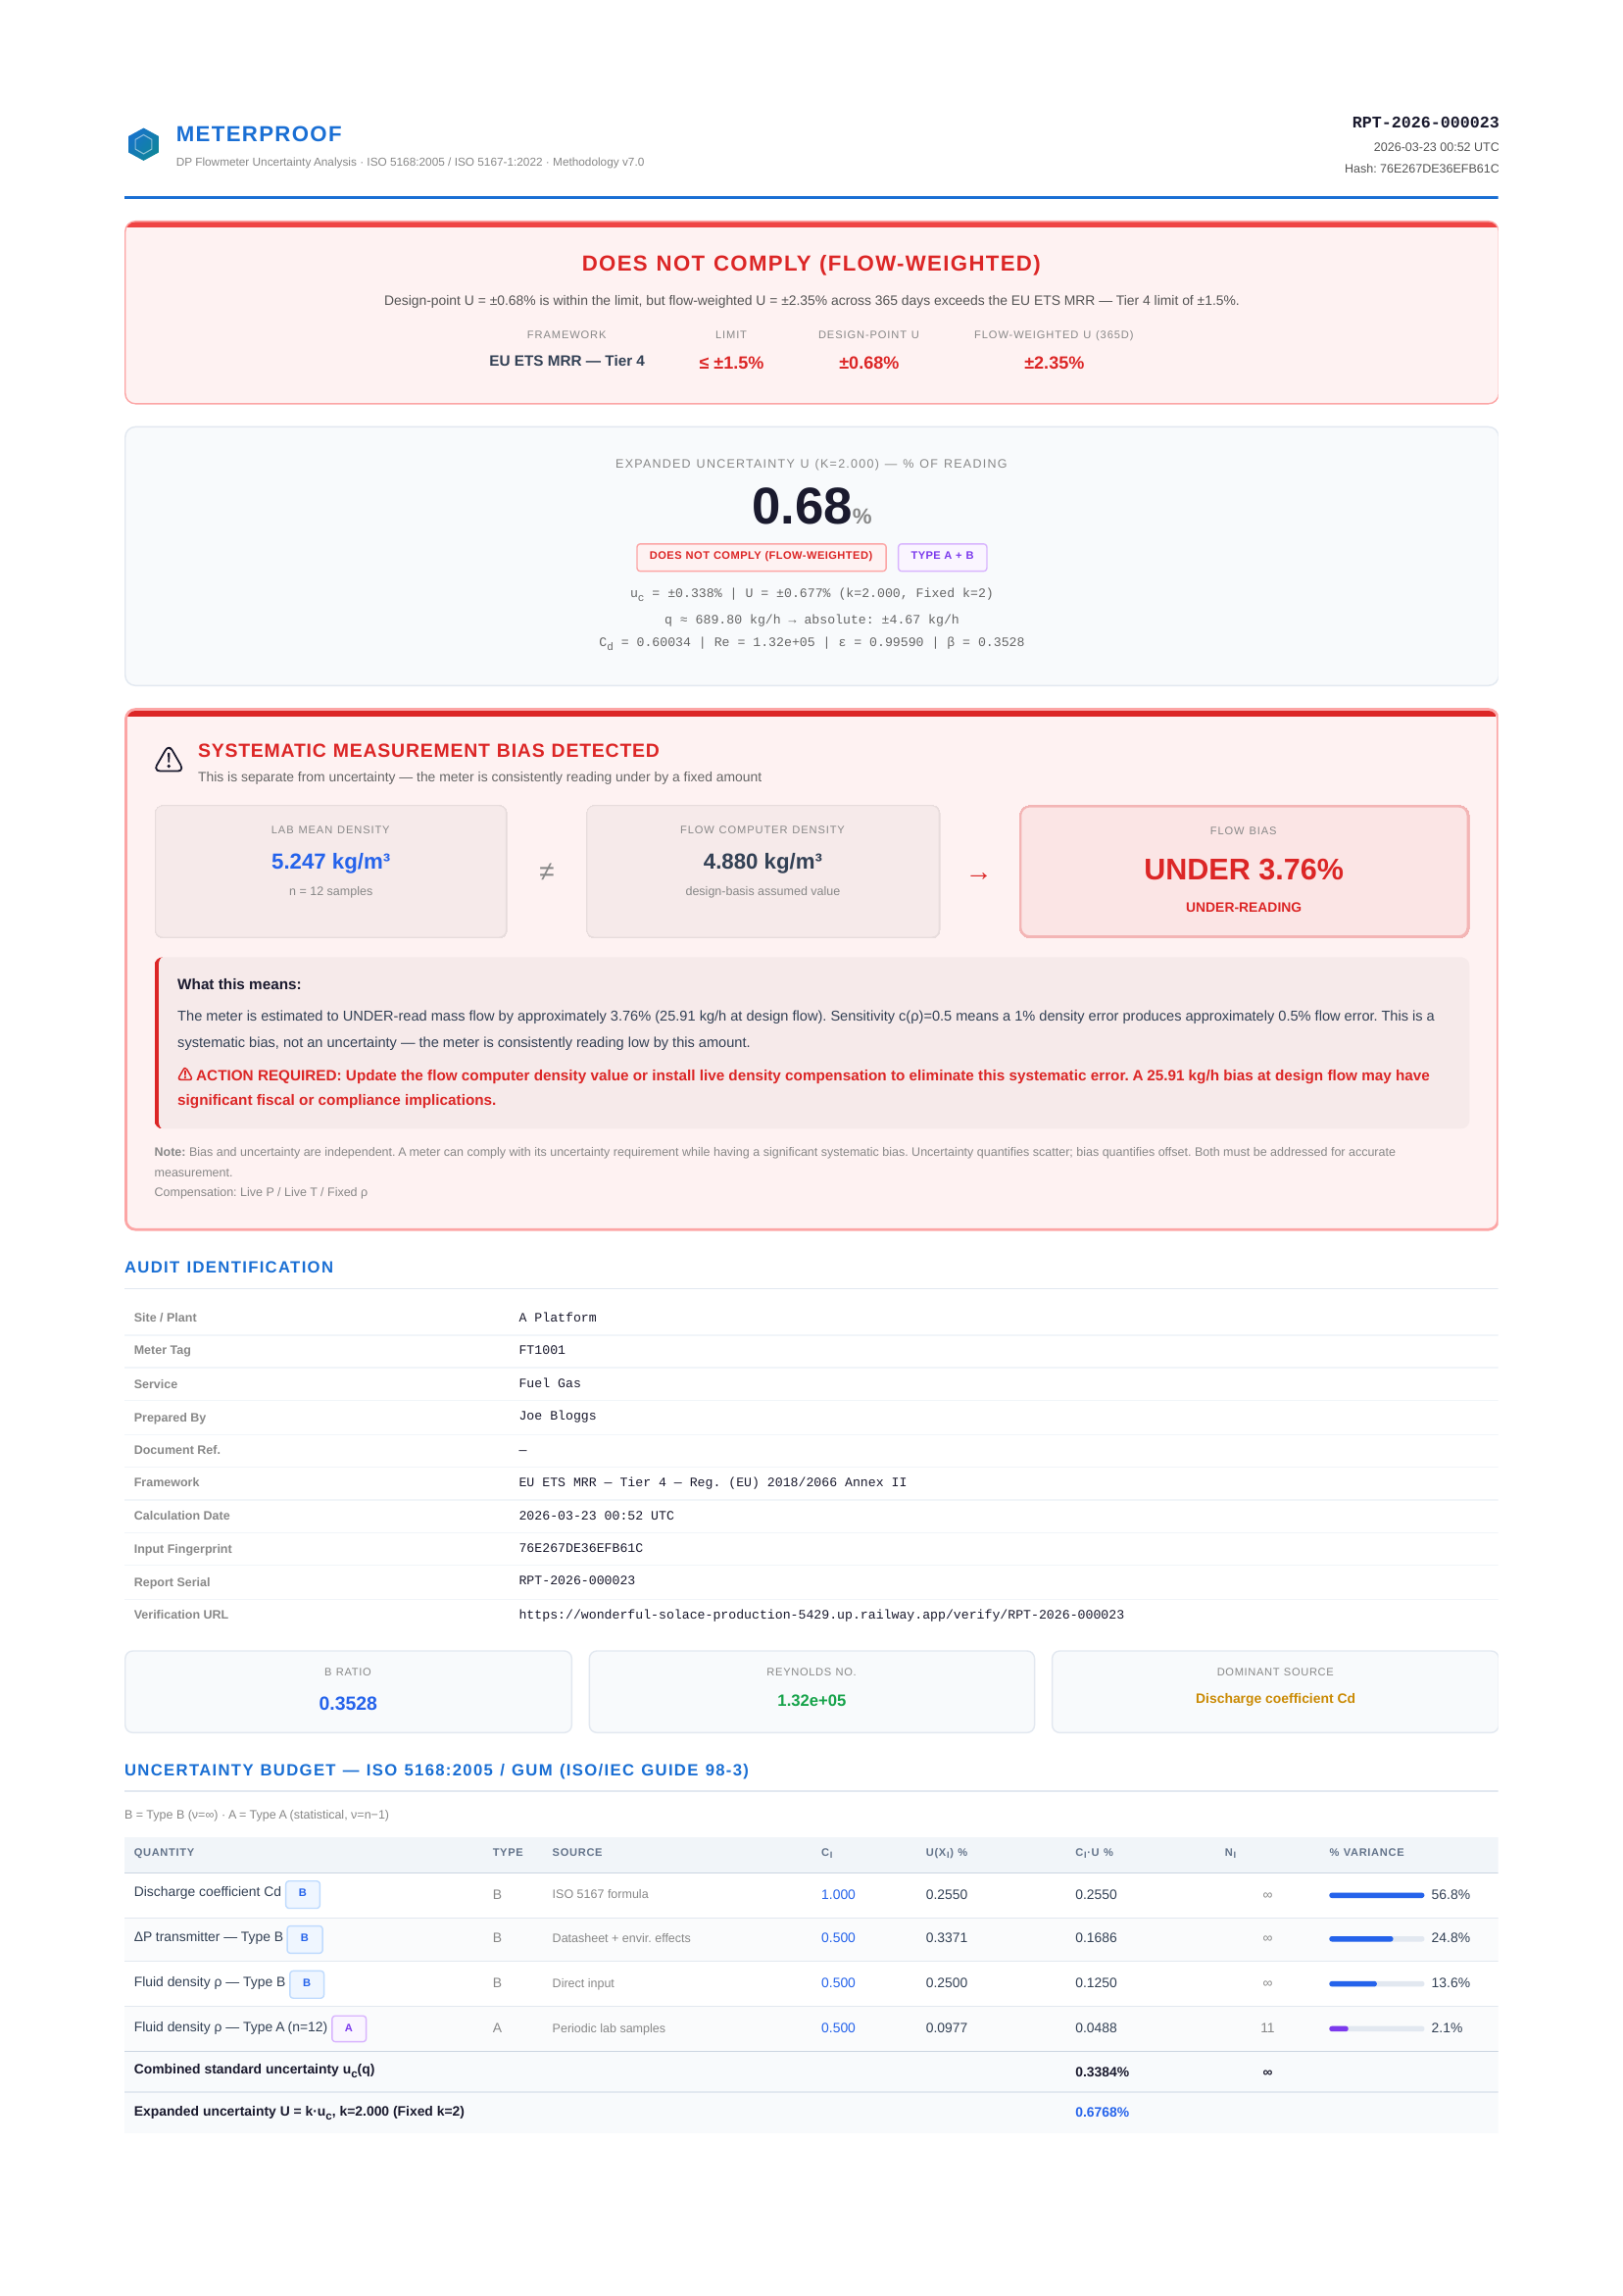
Flow-weighted compliance verdict

The headline verdict accounts for how the meter actually operates across the year — not just at the design point. If the flow-weighted uncertainty exceeds the framework limit, the report says so upfront.

Laboratory density flow-bias

Where lab samples are provided, the report quantifies the systematic measurement bias — how much the meter is over- or under-reading — separate from the random uncertainty.

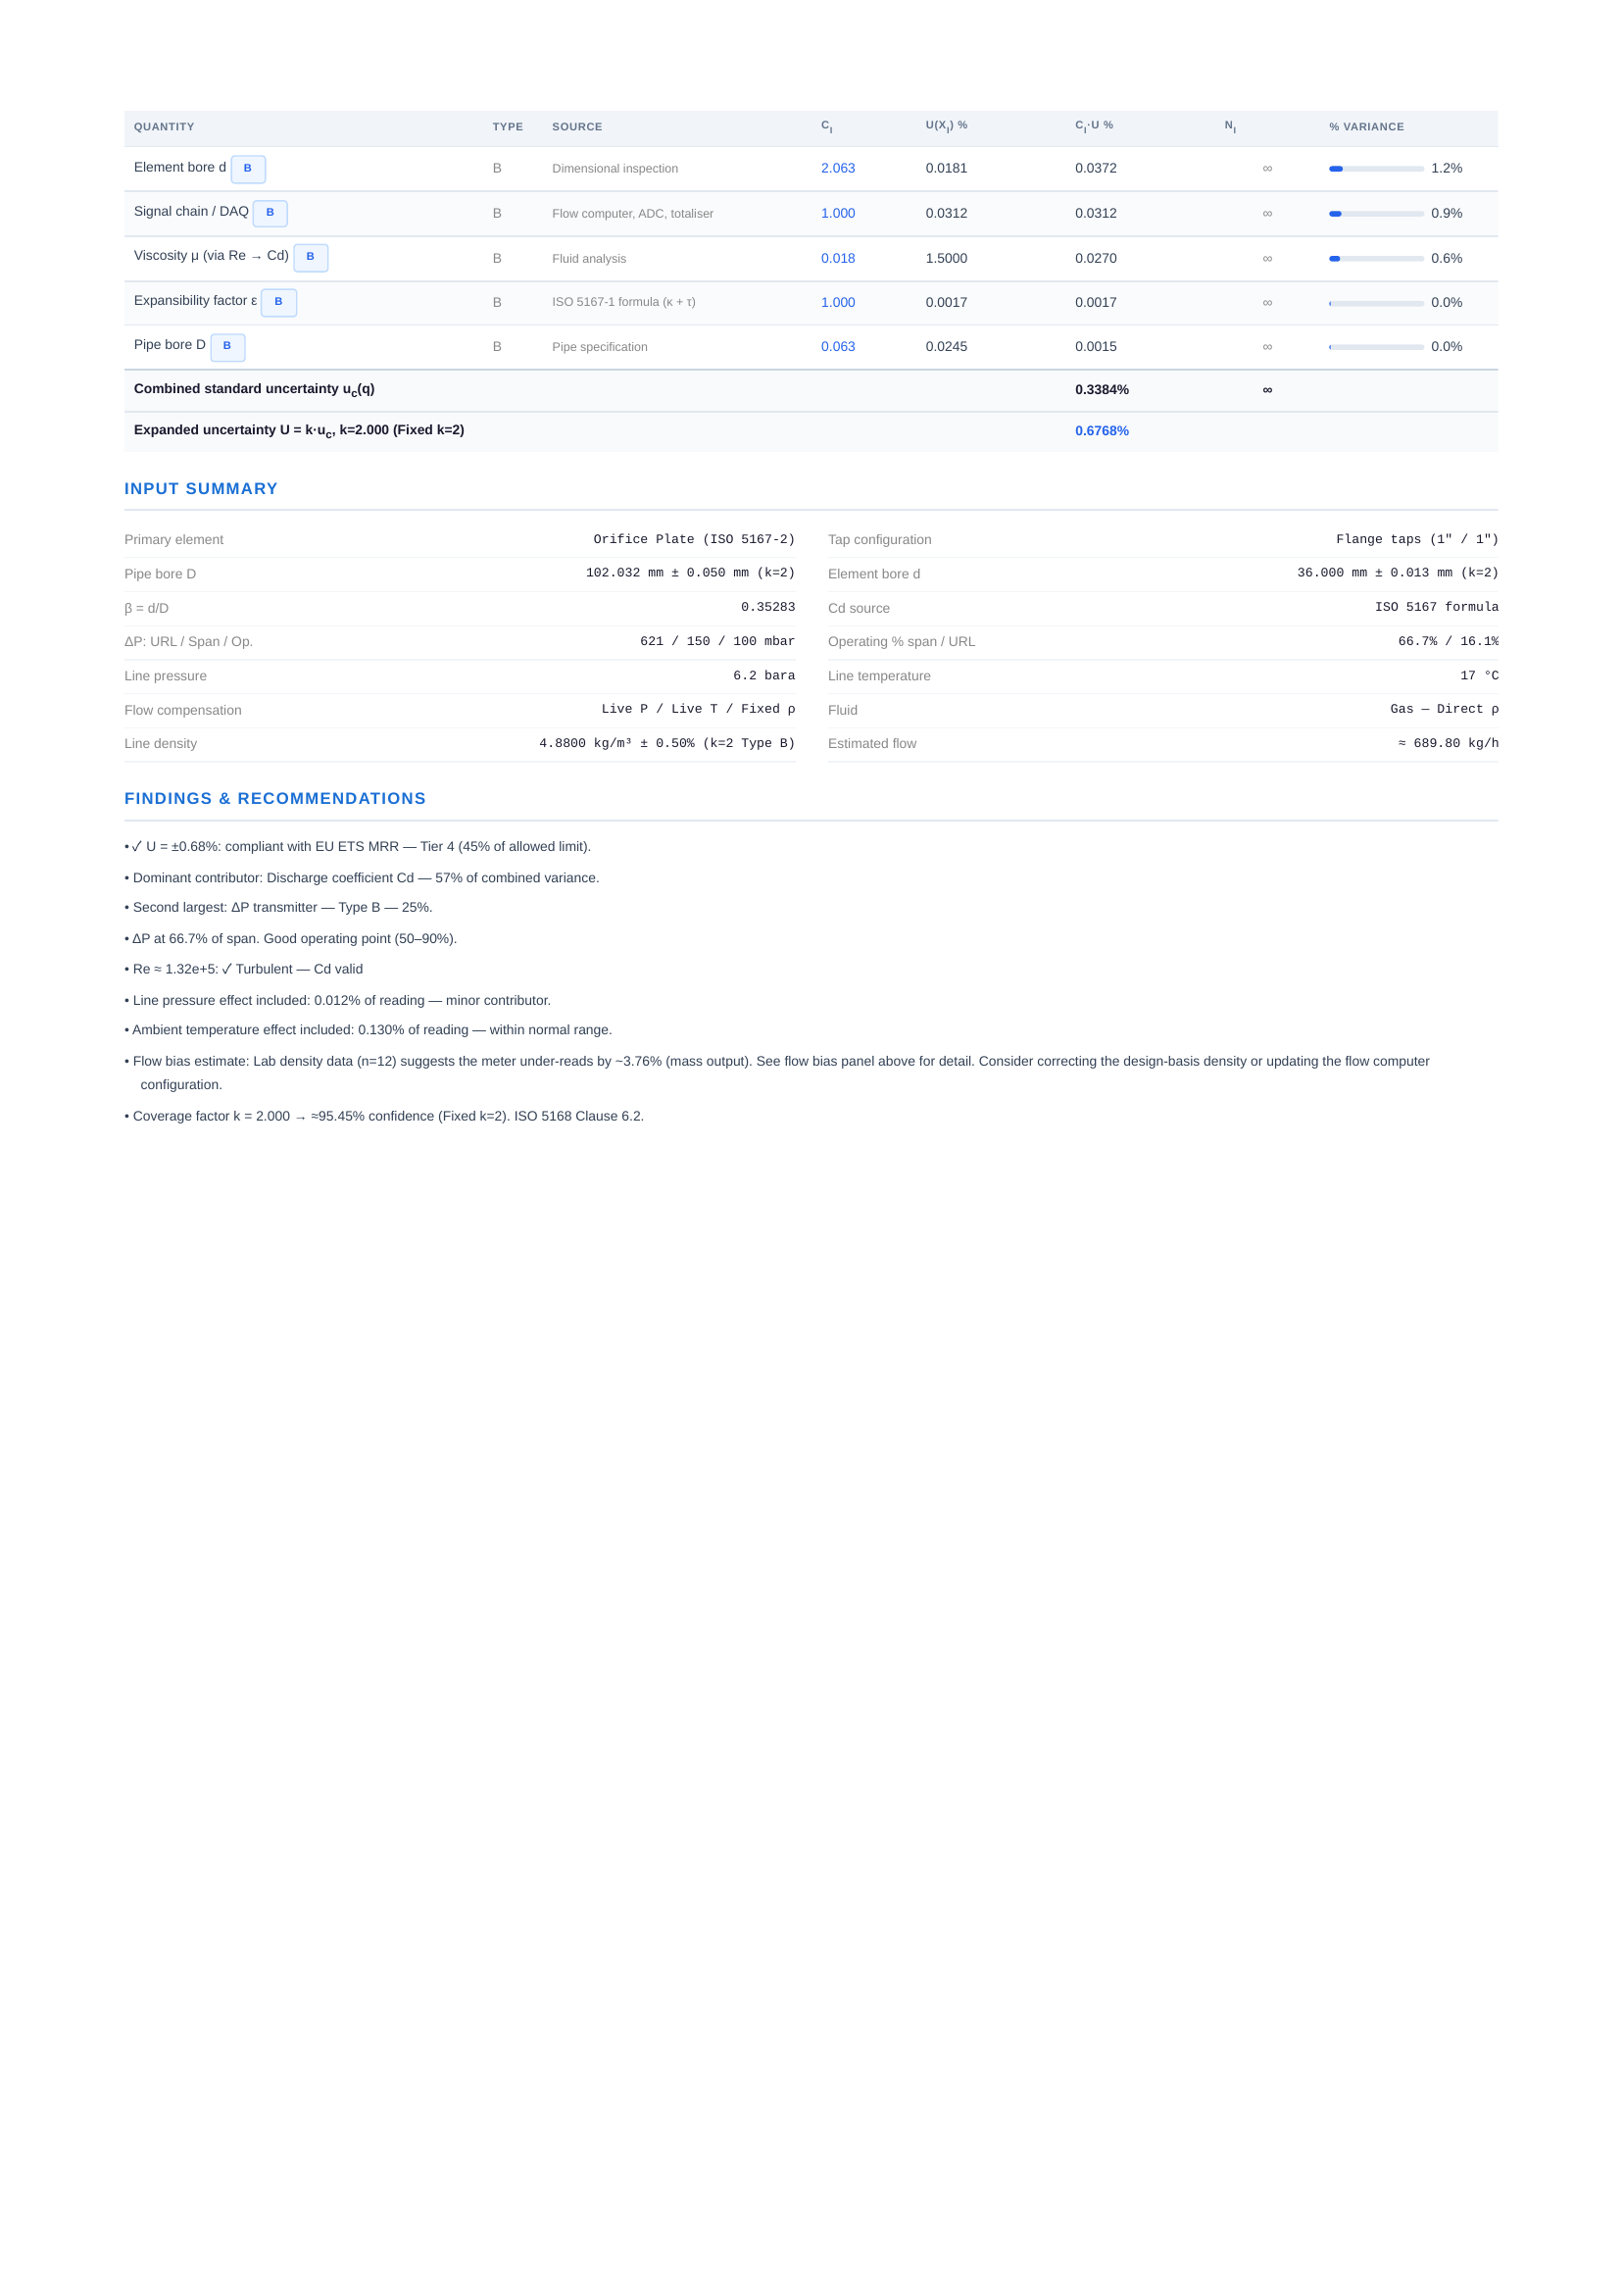
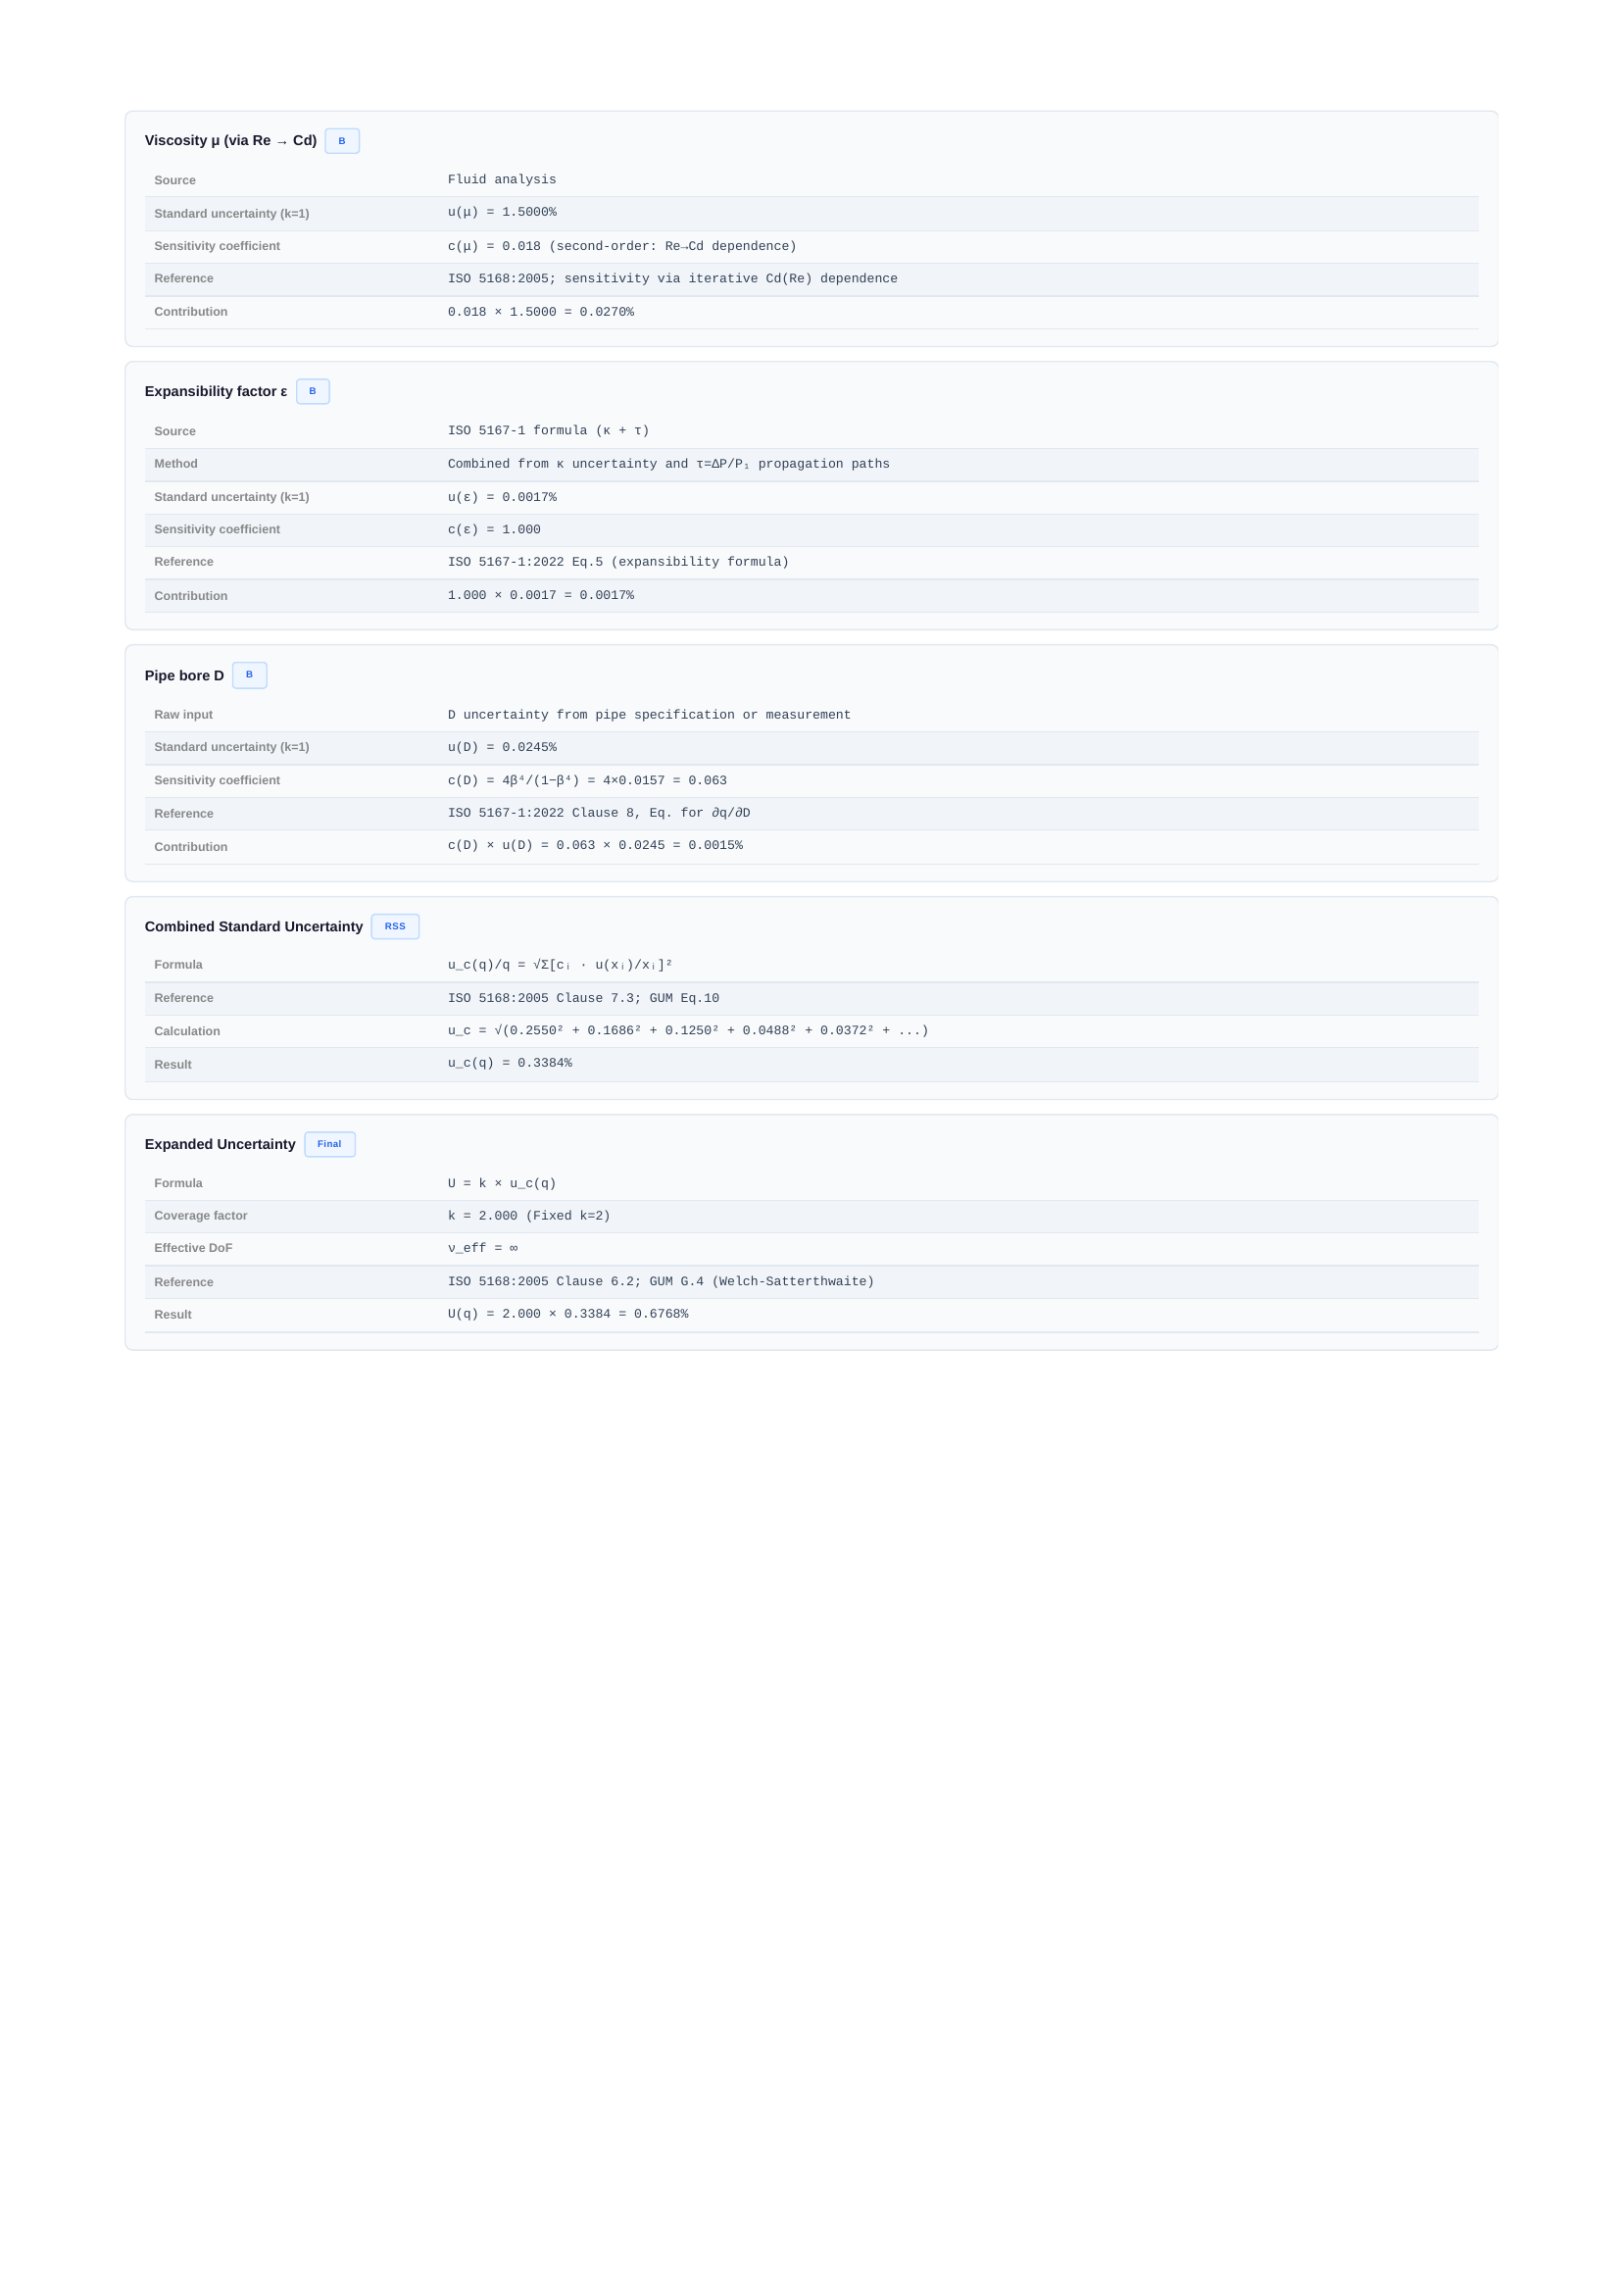
Detailed uncertainty budget

Each contributor shown with source, sensitivity coefficient, standard uncertainty, variance share, degrees of freedom, and Type A or Type B treatment per ISO 5168.

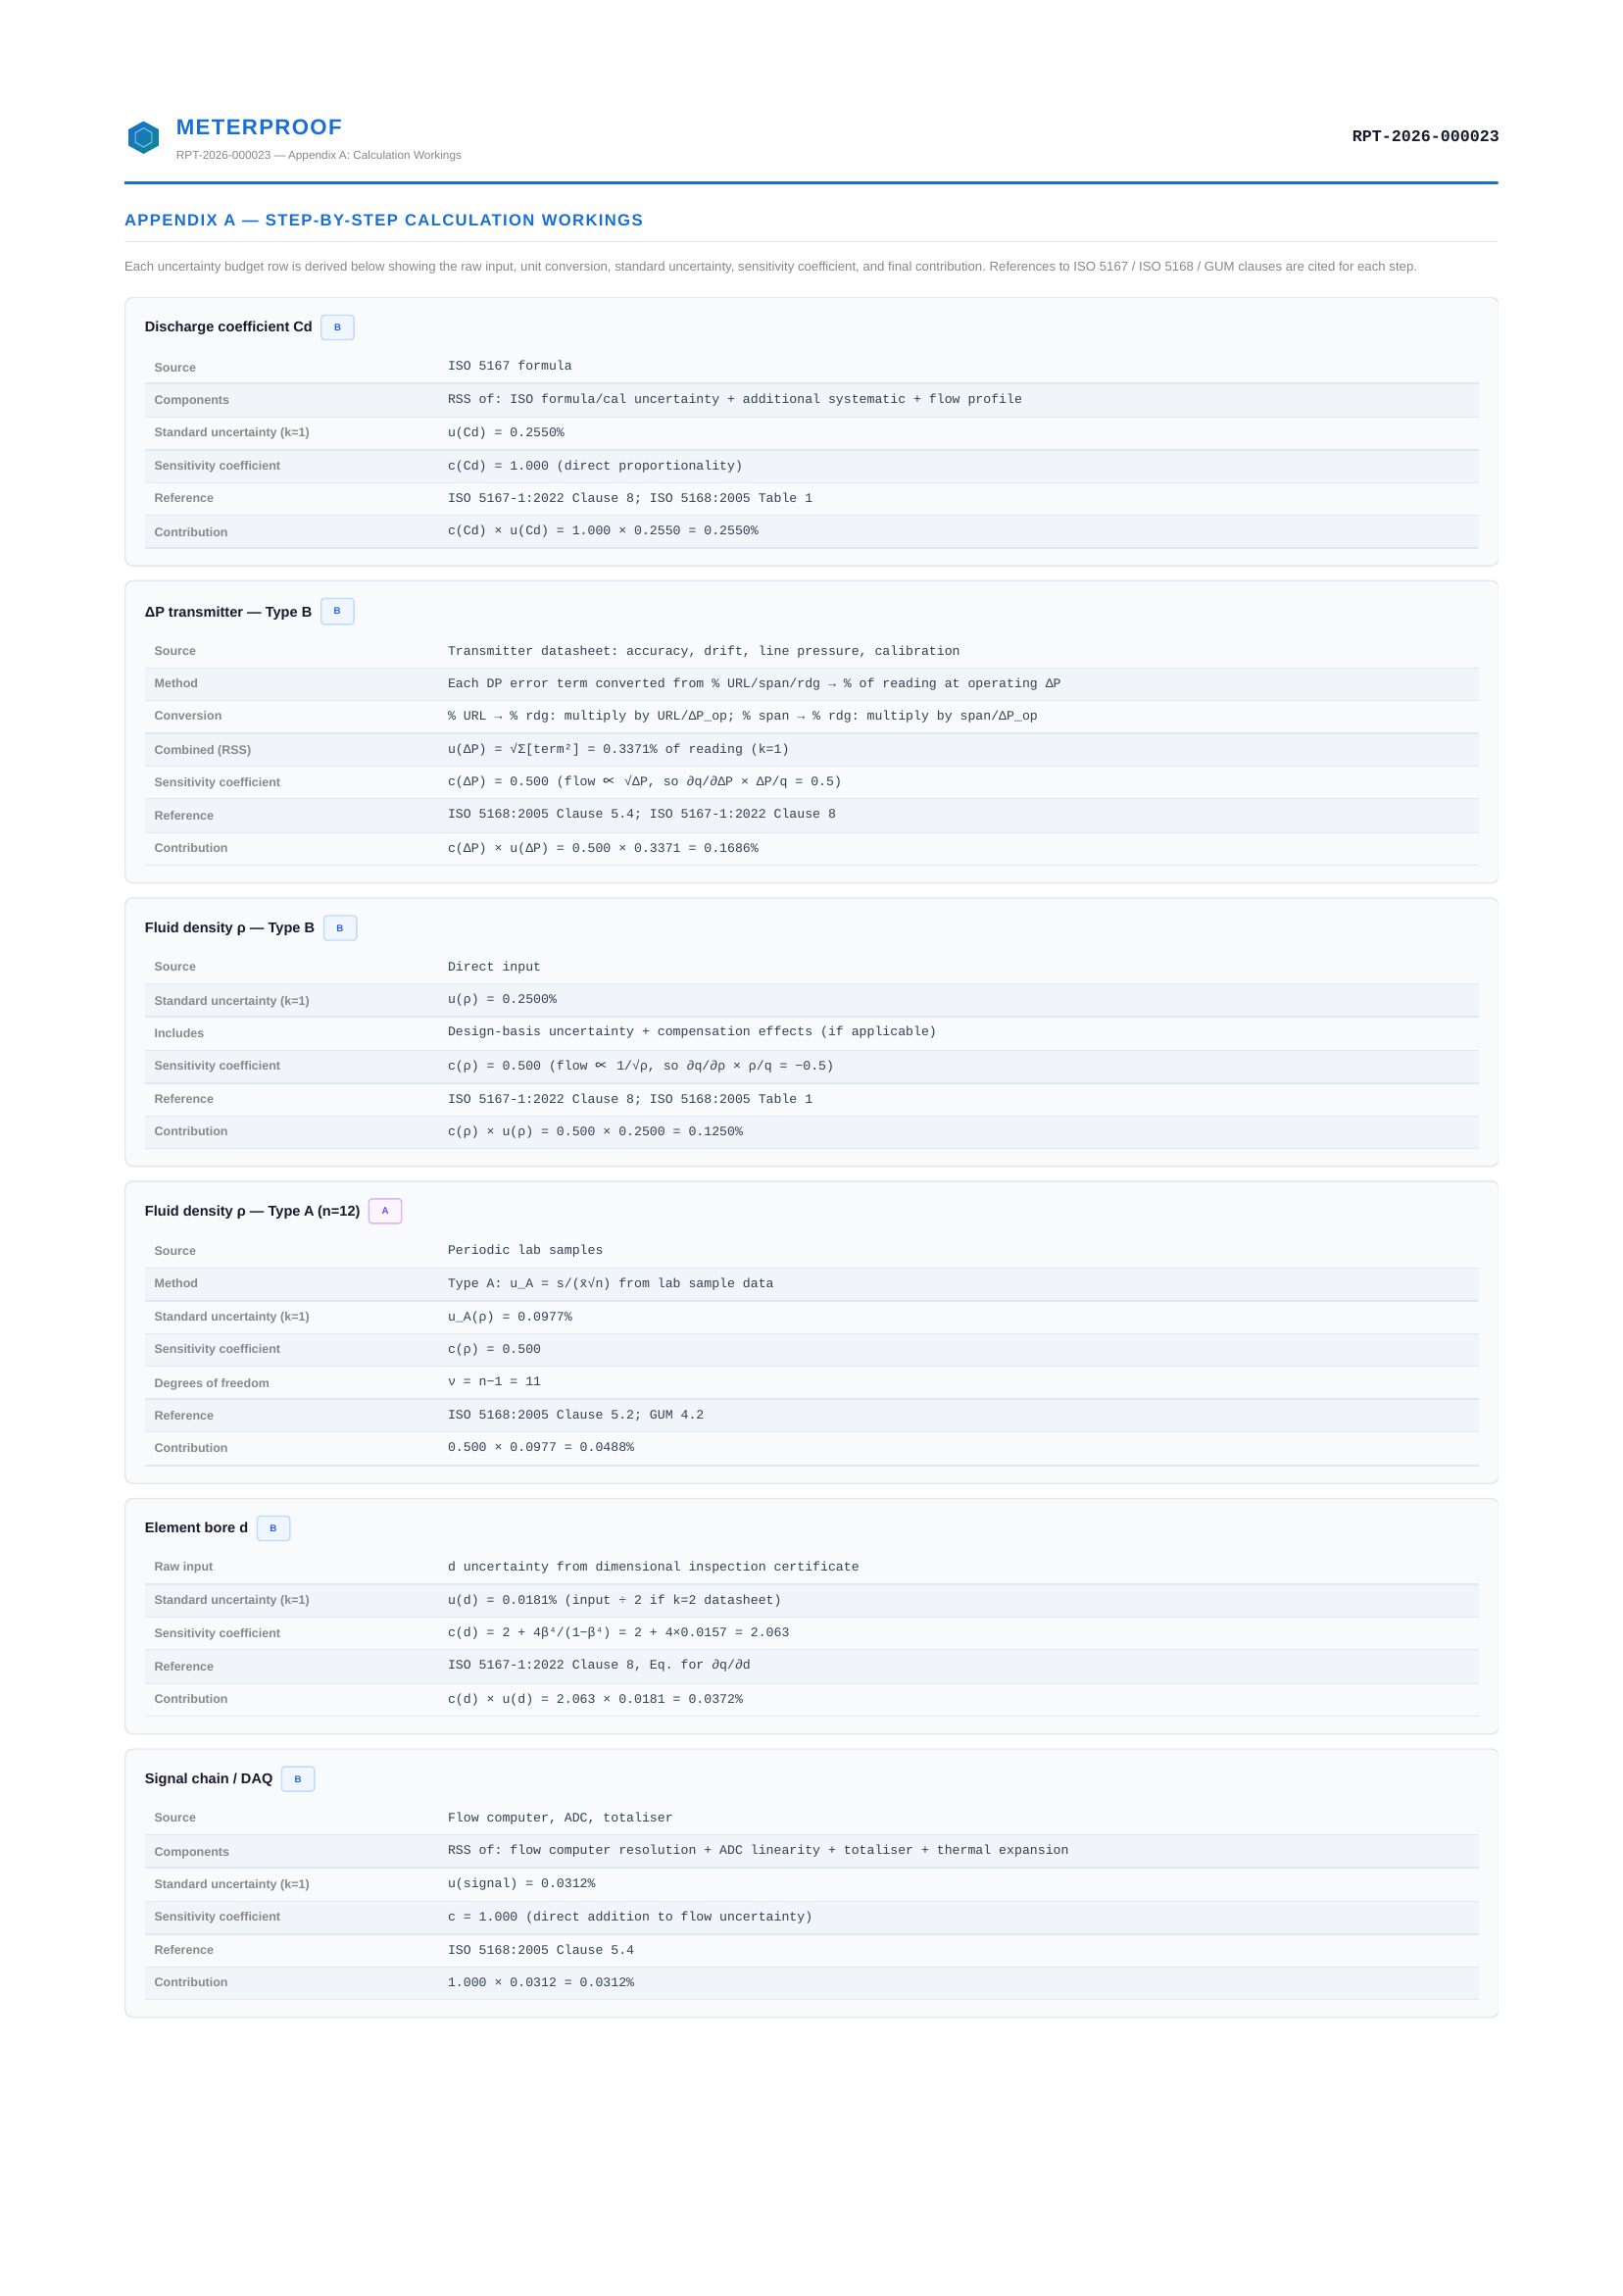
Calculation workings (Appendix A)

Step-by-step derivation for every budget row: raw input → unit conversion → standard uncertainty → sensitivity coefficient → contribution. ISO clause citations throughout.

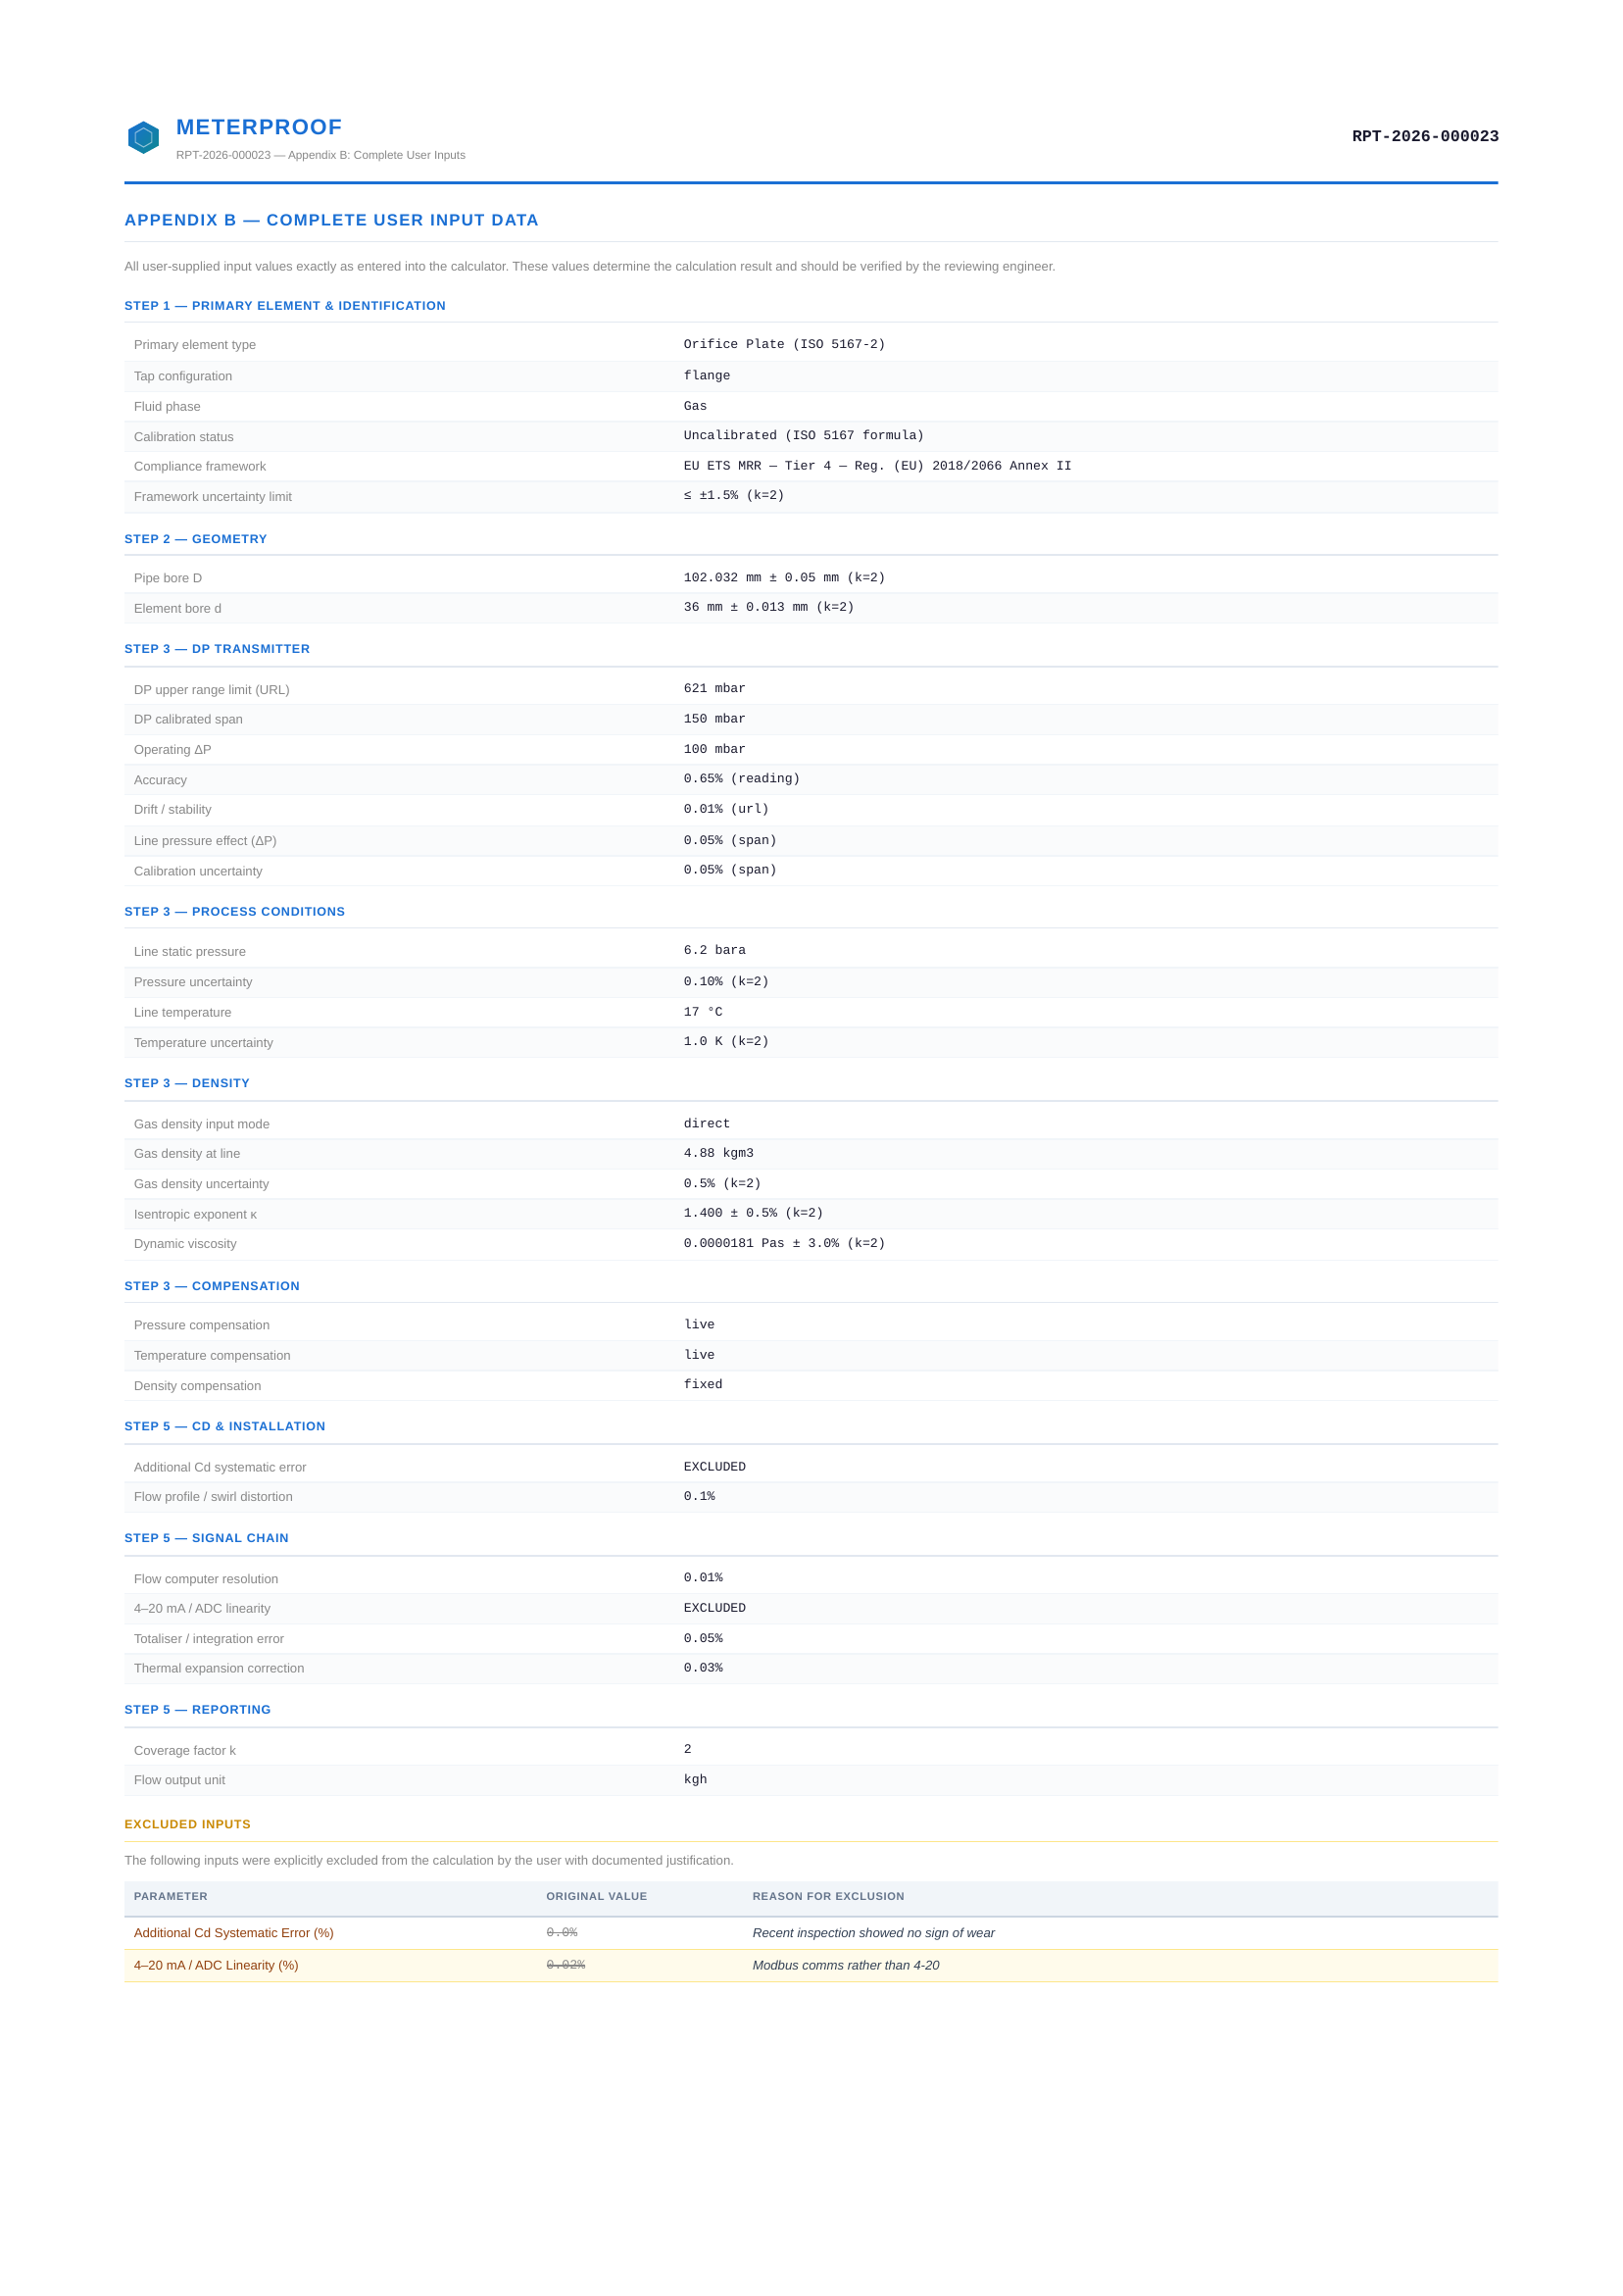
Complete input record (Appendix B)

Every user-supplied value exactly as entered, grouped by calculator step. Excluded inputs listed with the engineer's documented justification for each exclusion.

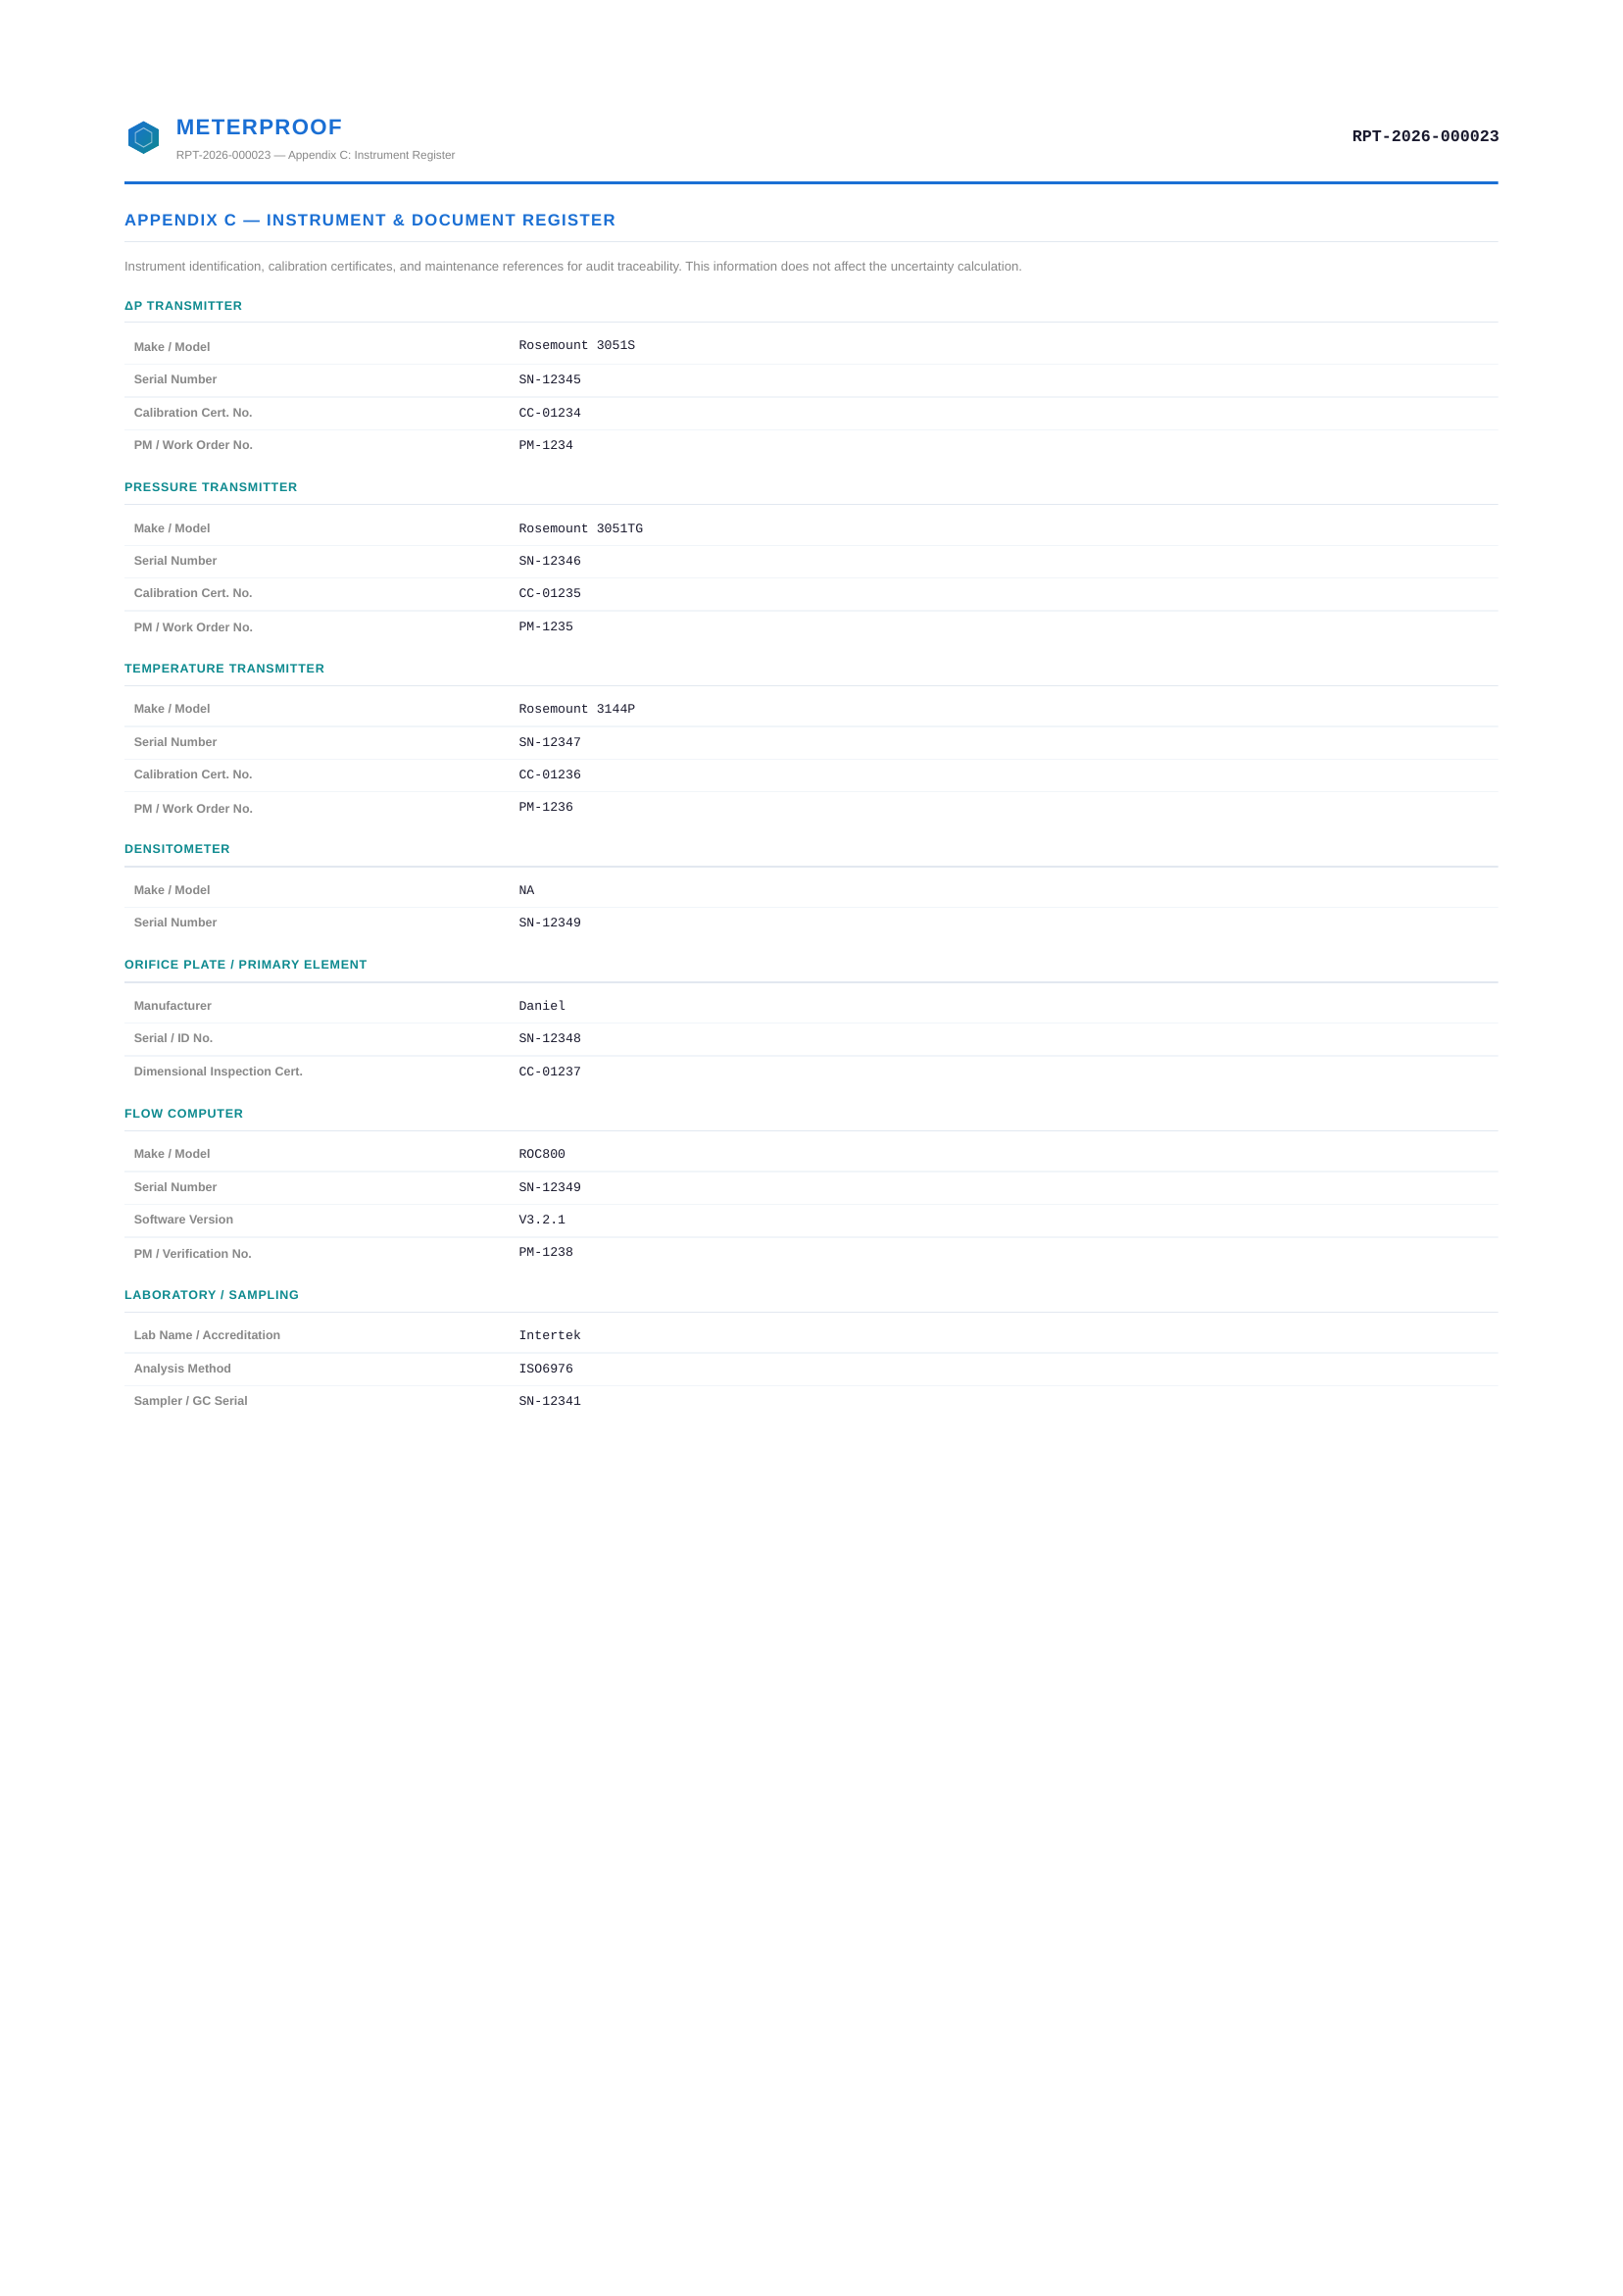
Instrument register (Appendix C)

Make, model, serial number, calibration certificate, and PM references for each instrument in the metering loop — DP transmitter, pressure, temperature, densitometer, plate, flow computer, and lab equipment.

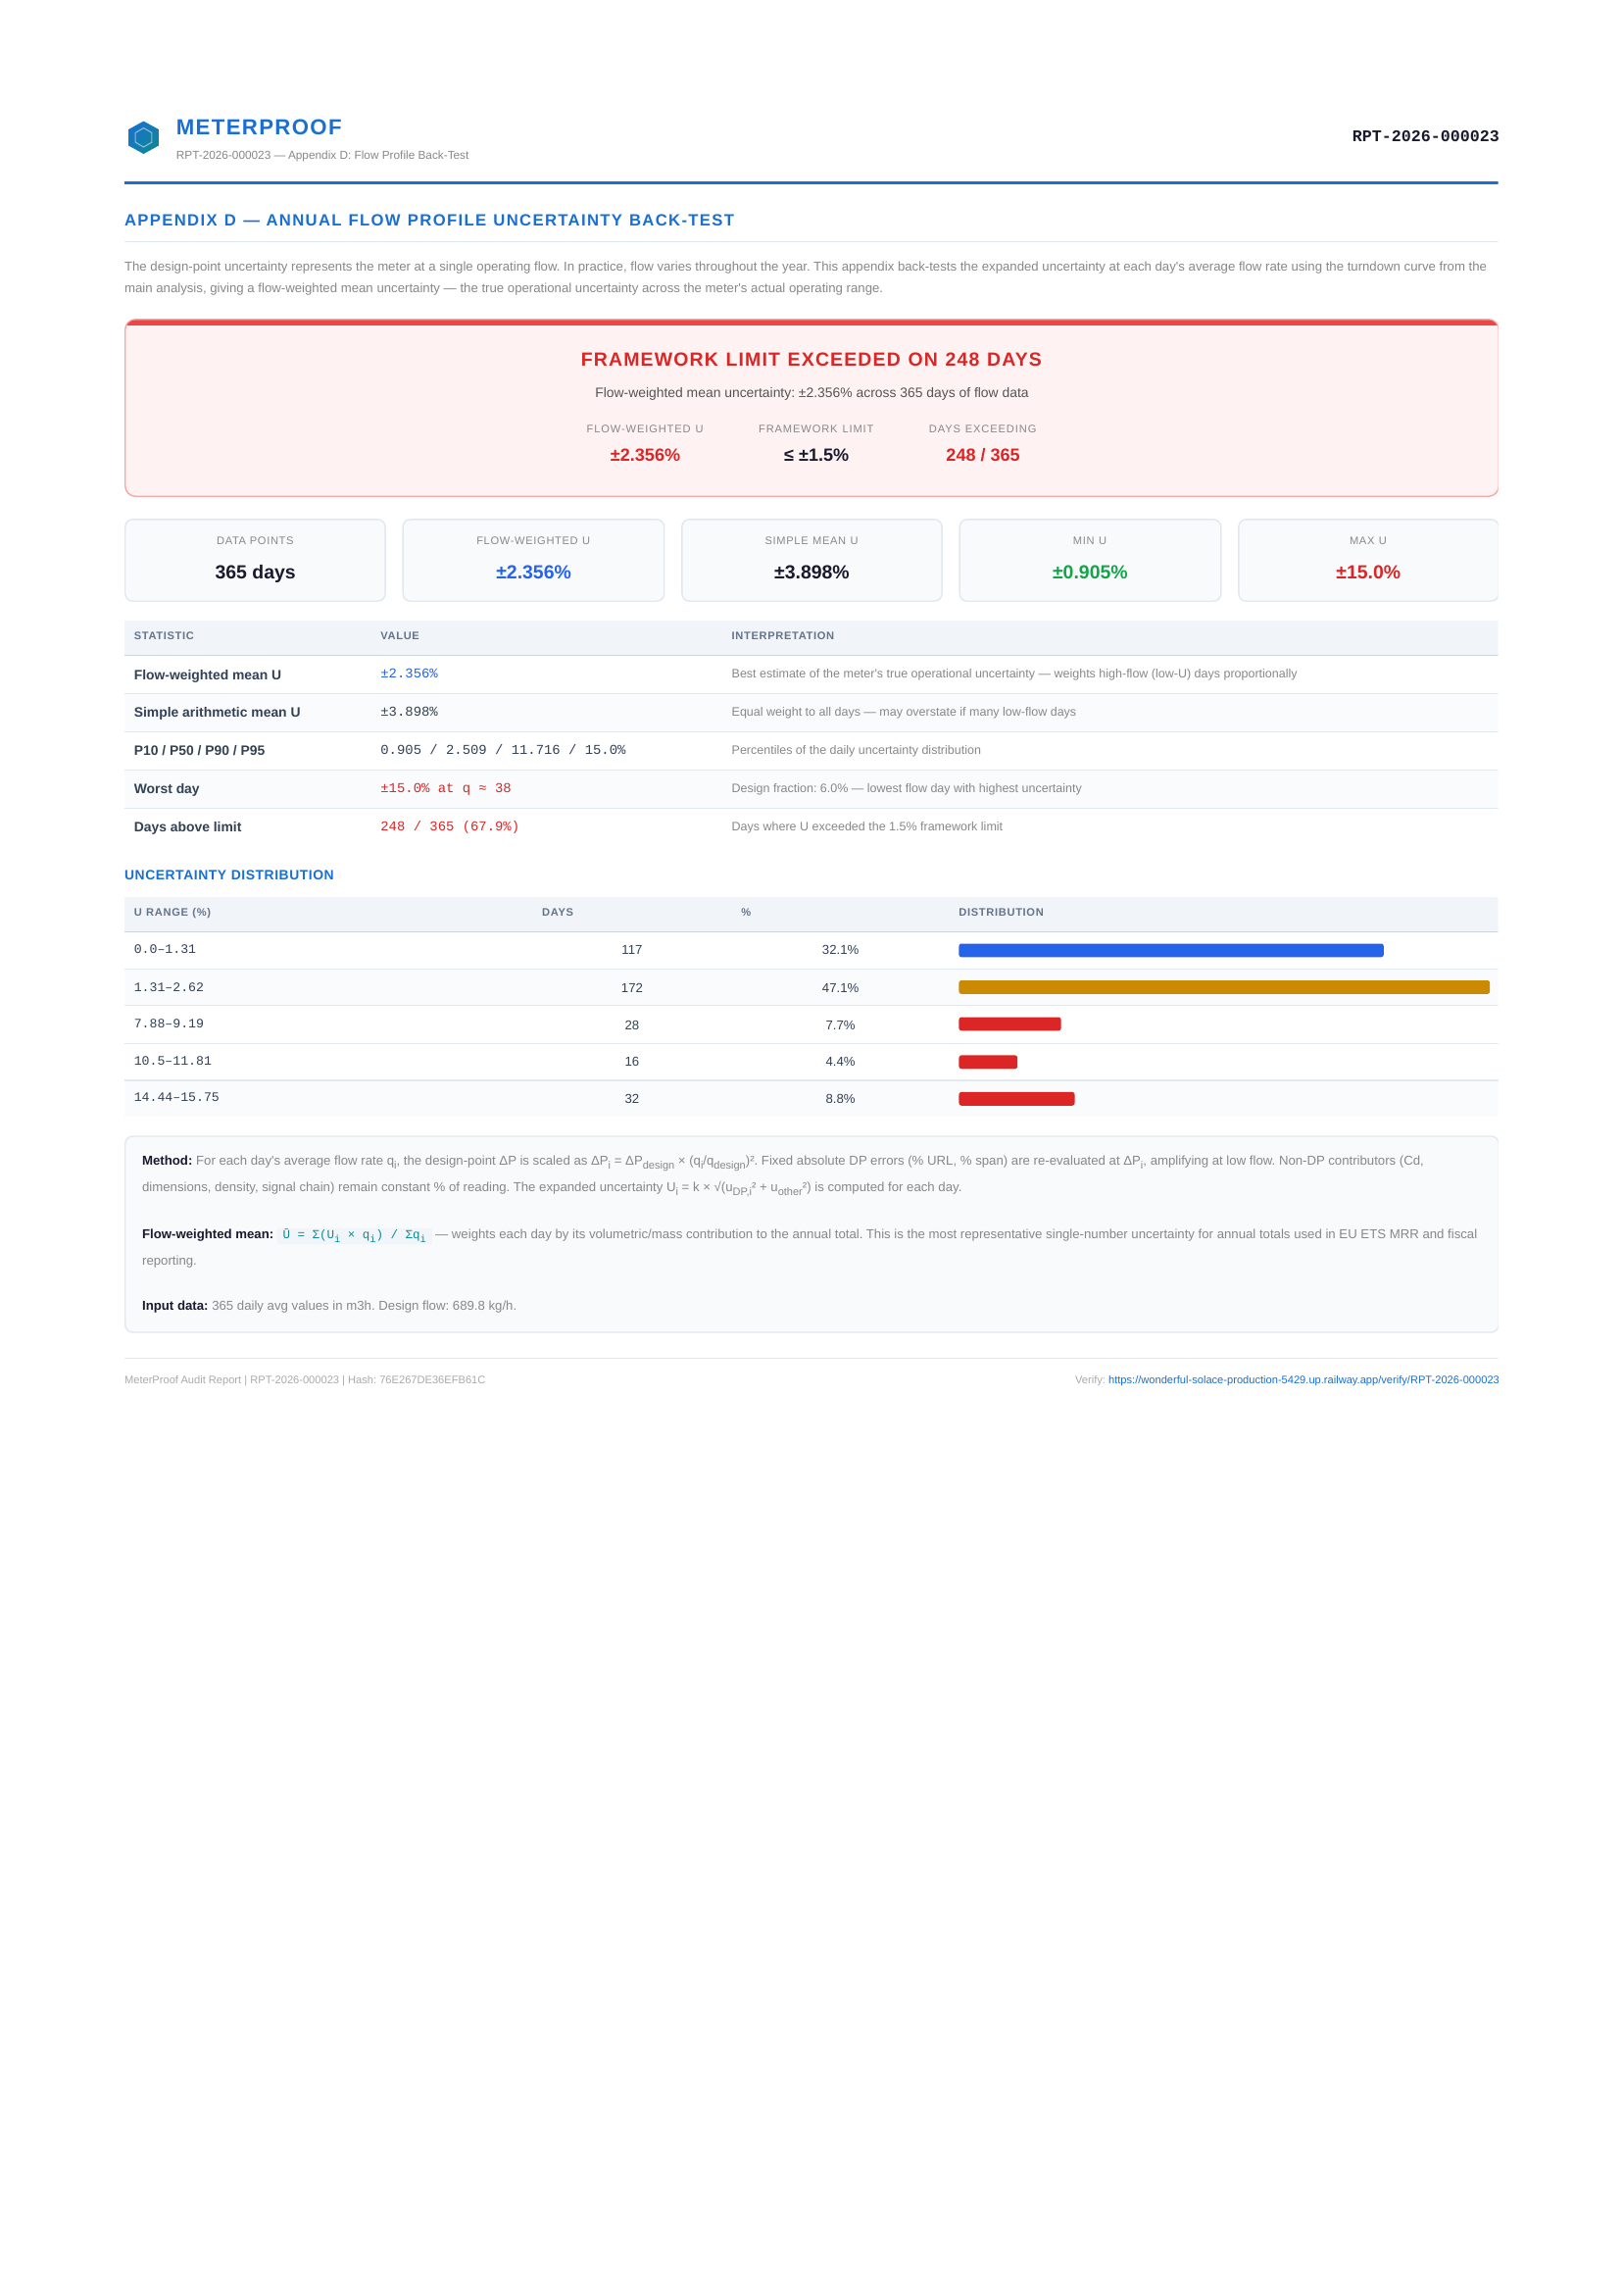
Flow profile back-test (Appendix D)

Back-tests the uncertainty at each day's average flow from the past year, producing a flow-weighted mean uncertainty, percentiles, distribution histogram, and worst-day analysis.
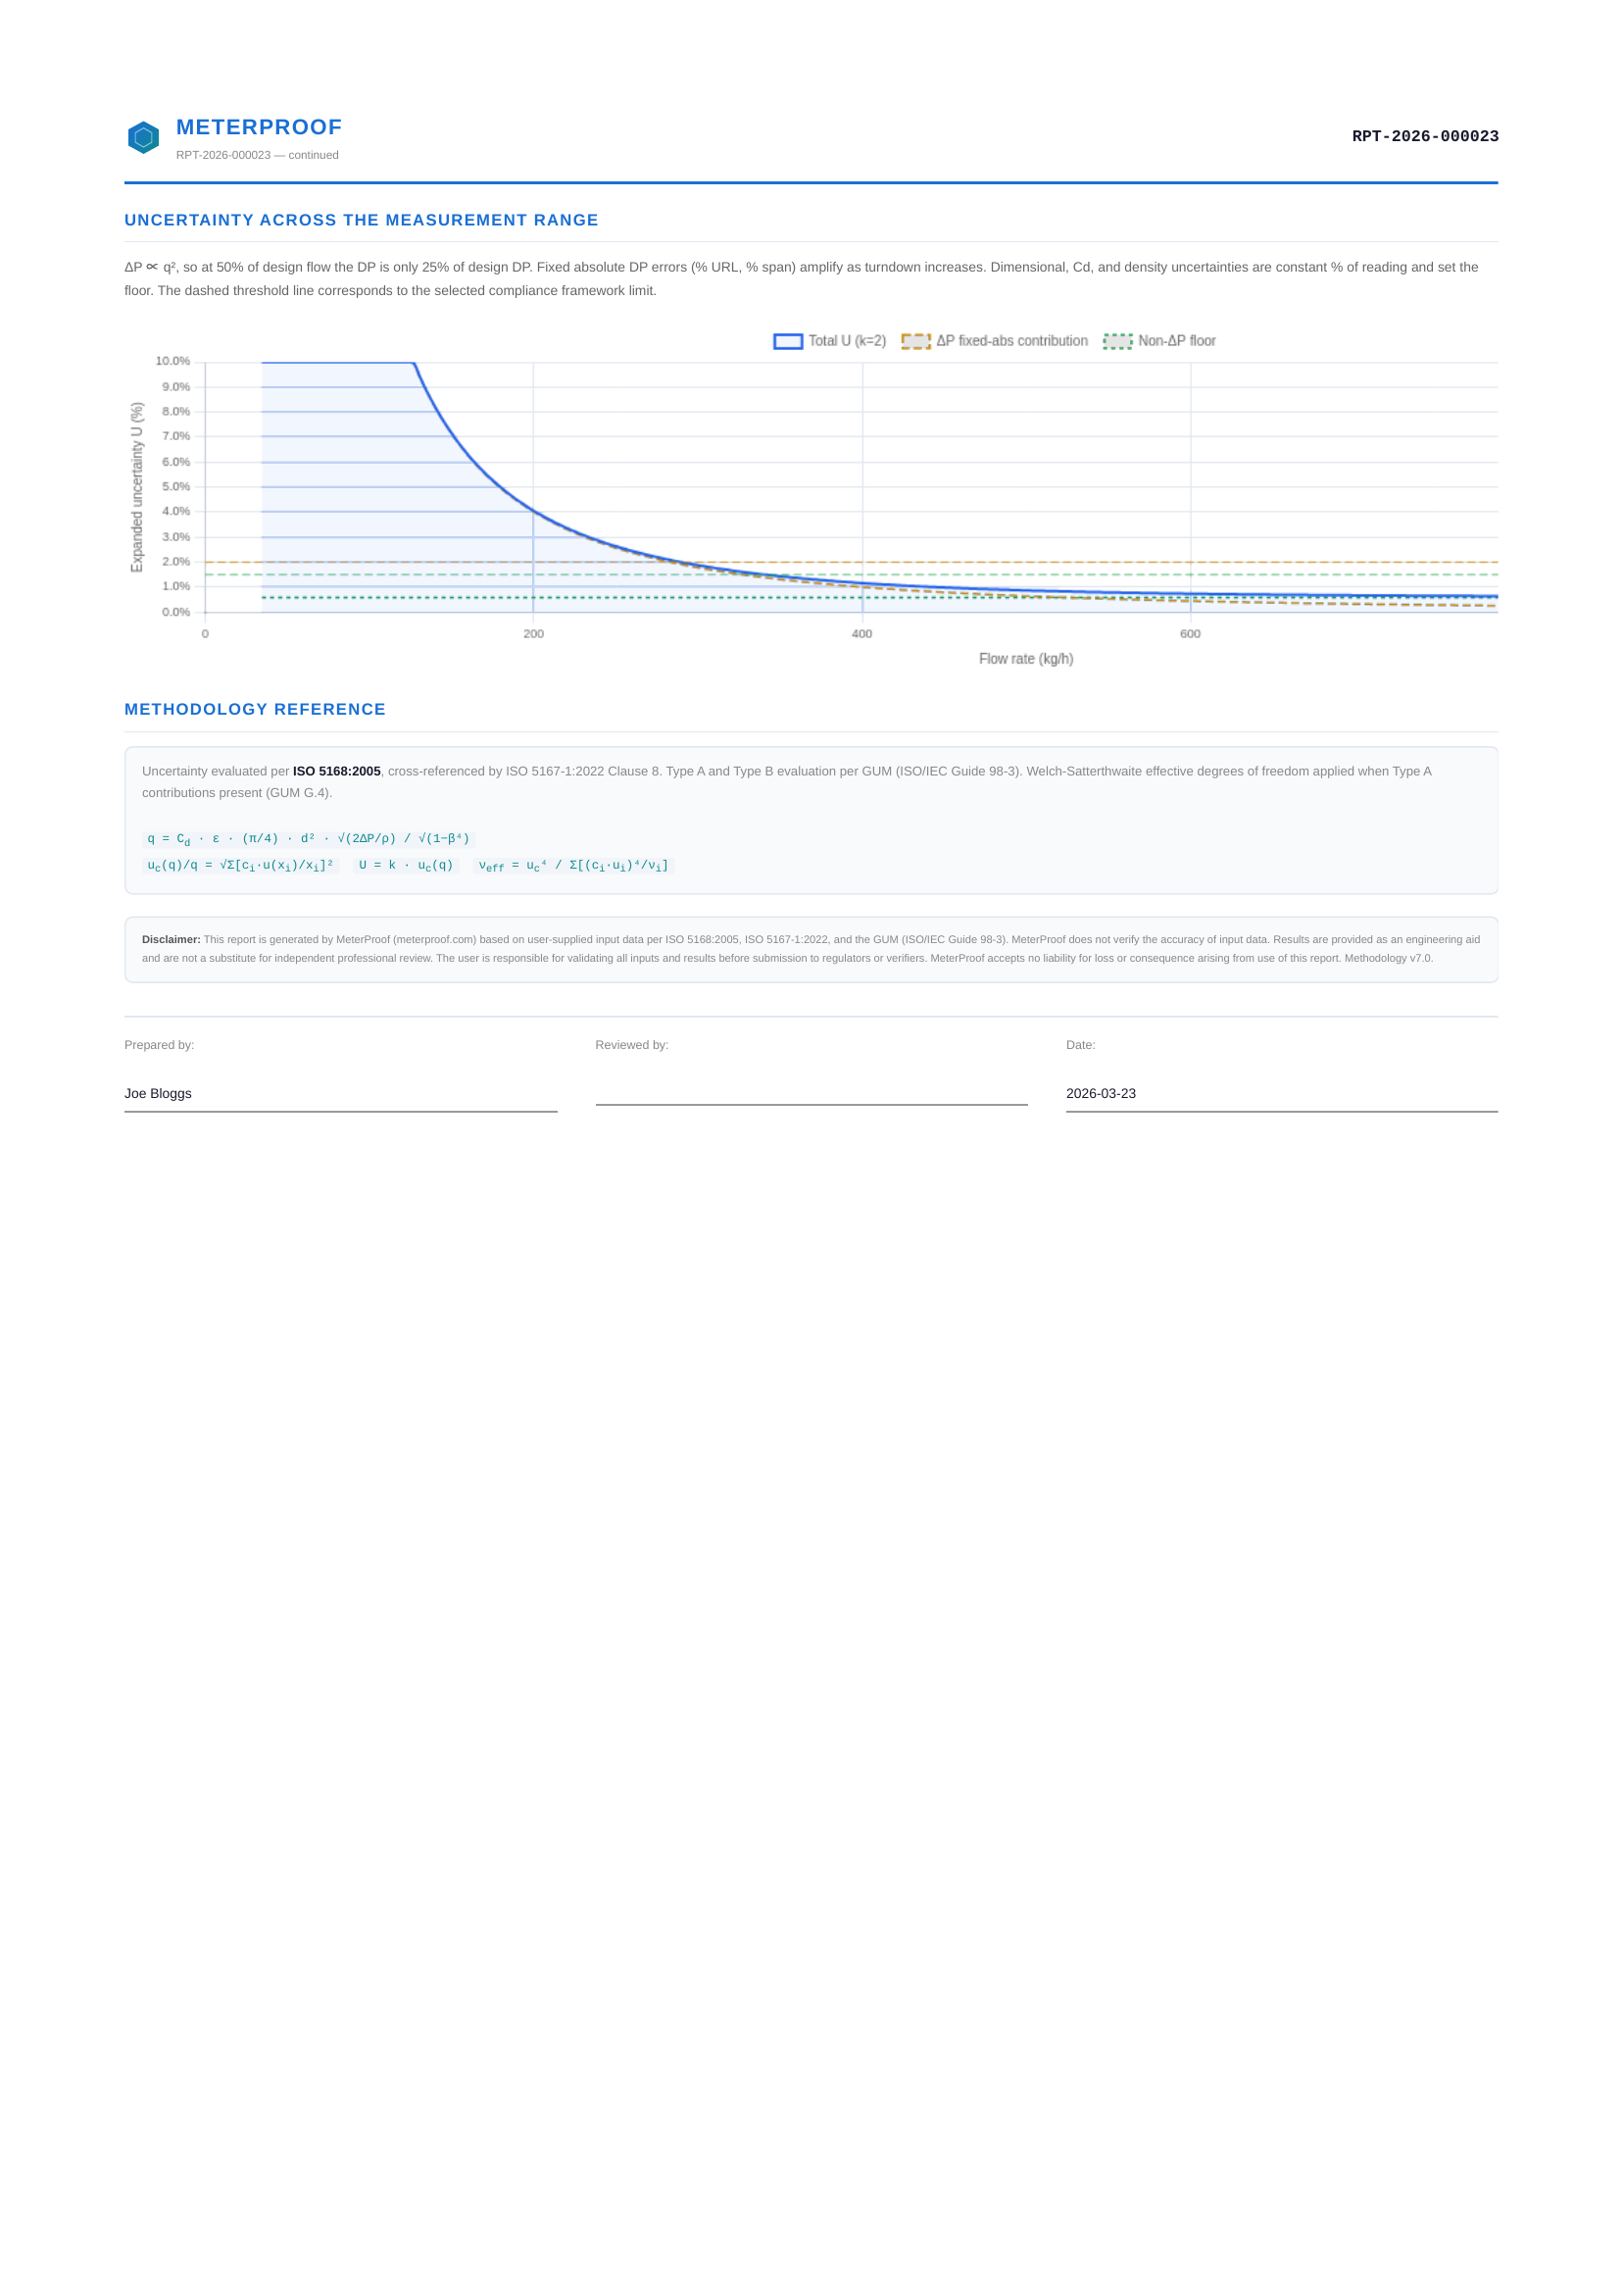
Turndown curve

Charts the expanded uncertainty from 5% to 120% of design flow, showing where ΔP errors amplify at turndown and where the compliance threshold is crossed.

Audit trail & traceability

Site, tag, service, engineer, document reference, framework, calculation date, input fingerprint hash, report serial number, and online verification URL.


All 8 pages from the sample report
These preview images come from an actual generated report, showing the full structure including the new appendices for calculation workings, input record, instrument register, and flow profile back-test.
Page 1 — Verdict, budget, bias
Page 1: compliance verdict with flow-weighted uncertainty, budget table, flow bias
Page 2 — Inputs, findings
Page 2: input summary, findings and recommendations
Page 3 — Turndown curve, methodology
Page 3: uncertainty across measurement range chart, methodology reference
Page 4 — Appendix A: Calculation workings
Page 4: step-by-step calculation workings with ISO citations
Page 5 — Appendix A continued
Page 5: calculation workings continued, RSS combination, expanded uncertainty
Page 6 — Appendix B: Complete inputs
Page 6: complete user input data with exclusion justifications
Page 7 — Appendix C: Instrument register
Page 7: instrument and document register with serial numbers and certificates
Page 8 — Appendix D: Flow profile back-test
Page 8: annual flow profile uncertainty back-test with distribution histogram

What this page is for

It lets you inspect the full 8-page PDF layout before you decide whether you need a report. The sample includes every appendix — calculation workings, complete inputs, instrument register, and flow profile back-test — so you can see exactly what your verifier will receive.

Important note

The report is designed to support technical review by clearly presenting the basis, assumptions, and uncertainty result. The flow-weighted uncertainty accounts for real operating conditions. Final acceptance depends on the applicable framework and the reviewer’s assessment.

Run the analysis first. Generate the report when you need the formal output.

The usual path is to test the basis in the calculator, then create the structured PDF once you are ready to capture the result formally.